

Performance Management Metrics & Ratios
Business Intelligence with quantitative models
|
AIM – Activity Information Modeling performance metrics deliver new and powerful information to managers and their organizations. They help managers understand the dynamic forces that are creating their performance outcomes. They offer the best benchmarks from which to design transformation and improvement programs.
In the past, calculating just one of these metrics and ratios in service operations, with traditional methods, was extraordinarily expensive and time consuming… basically impossible and economically unfeasible. Historically, they were prepared with qualitative information from observations, surveys, stopwatch studies, and always “estimates”. AIM—Activity Information Modeling changes the game. It collects tens of thousands of data points within days and assembles them into a quantitative information database.
These performance ratios are often prescriptive, they tell us what the solutions are to the problems, and what actions are necessary to achieve performance goals. They are also descriptive and predictive. They describe, with quantitative data and metrics, the dynamics and the problems. Because the data is both homogenous and quantitative it predicts outcomes with very high accuracy. This allows us to easily create and evaluate numerous scenarios before adopting transformation plans.
The performance metrics and ratios listed here are some of the cost common ones for all industries.
These performance metrics & ratios offer the fastest management tools to jump start lackluster profits and a lethargic P/E ratio. These new and powerful information tools achieve new results without fail.
|
3 Vital Performance Metrics
There are many performance metrics, and each industry has some that are unique to itself. The 3 metrics that are listed below are the most important and are common to all businesses.
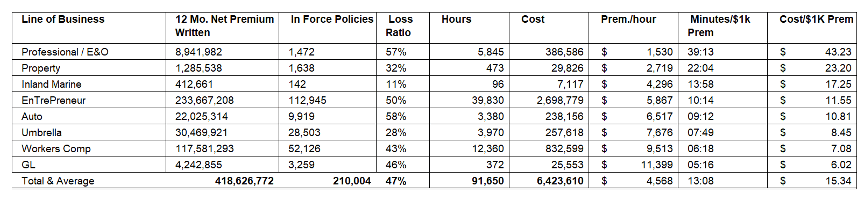
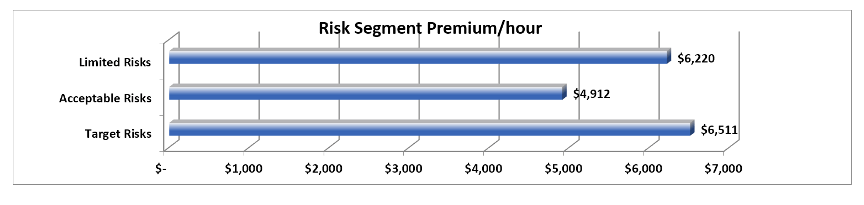
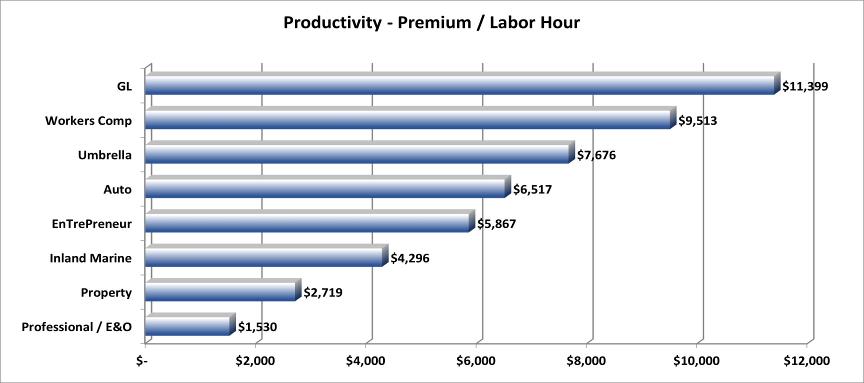
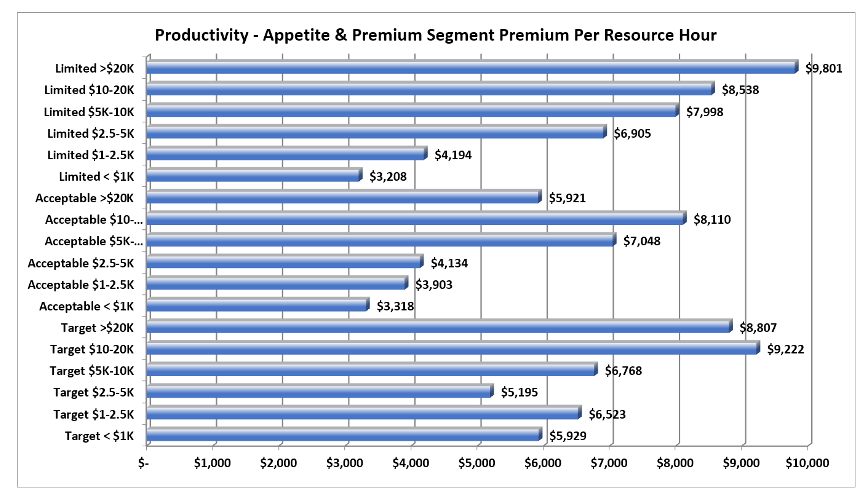
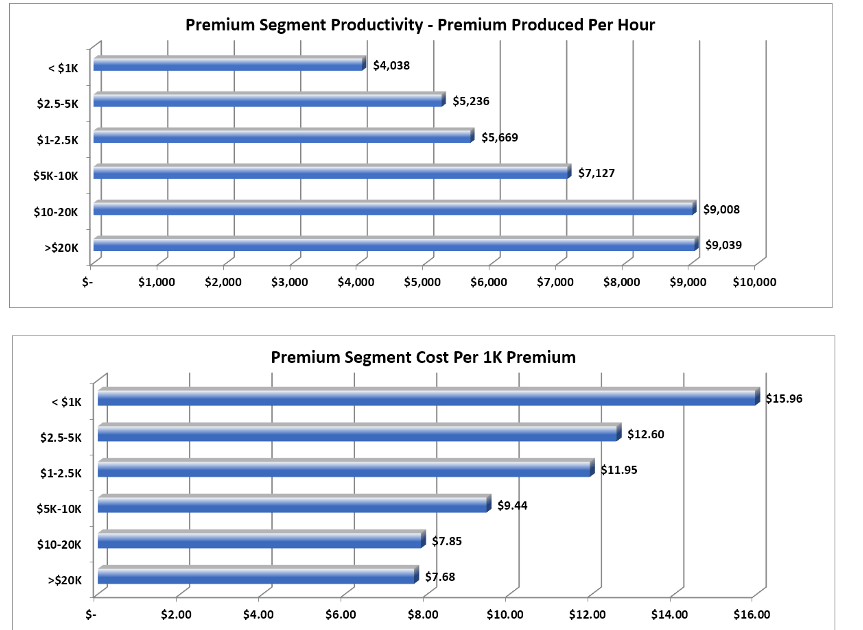
Productivity Metrics
Revenue/time & revenue/expense, usually referred to as “output over input” is the fundamental metric of every business. Nothing good happens until substantial productivity is achieved.
High productivity is a “silver bullet”. This one strategy achieves many outcomes.
- It gives a company a high ROI on its capital and tends to boost its stock price.
- It allows the company to have highly competitive compensation and thus attract the best talent in the industry and enjoy high resource retention– which reduces staffing expense, especially hiring and training.
- In turn, high employee retention creates high customer retention and loyalty which reduces customer acquisition expenses.
- High productivity naturally produces higher profits and margins that fund innovation and organic growth.
- Finally, high productivity allows companies to make profitable acquisitions by buying competitors with lower productivity and merging them into the buyer’s higher productivity operations, with higher profit margins.
The productivity levels of the profit and growth leader, in every industry, is among the highest and usually the highest in that industry.
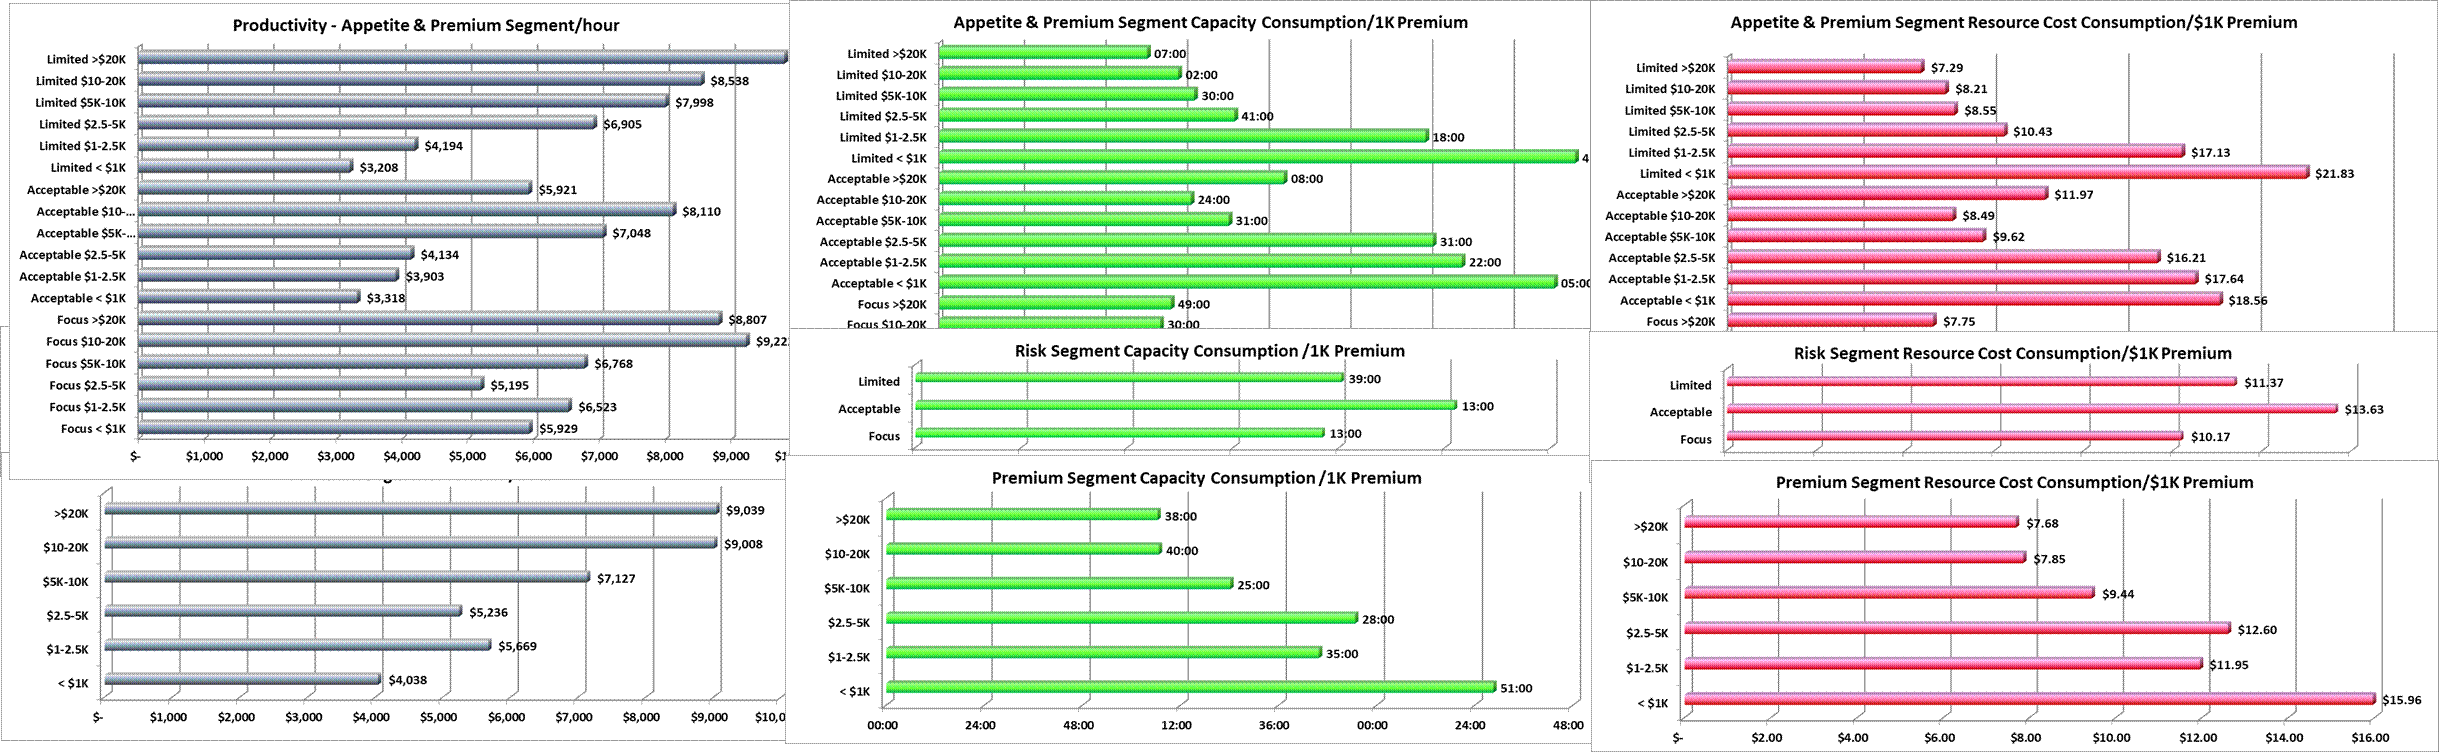
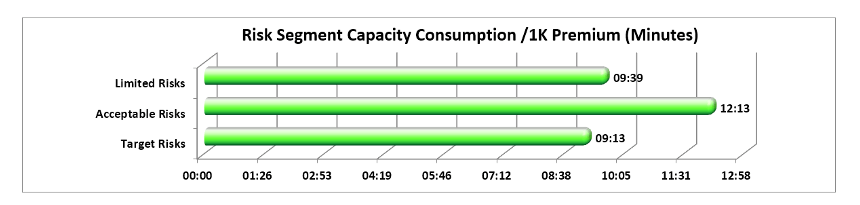
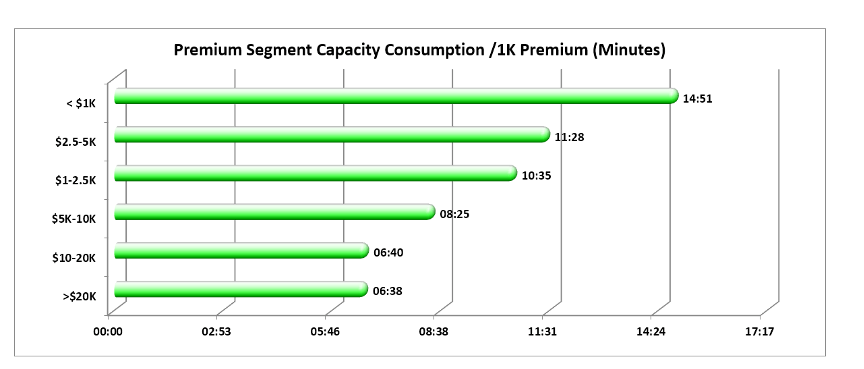
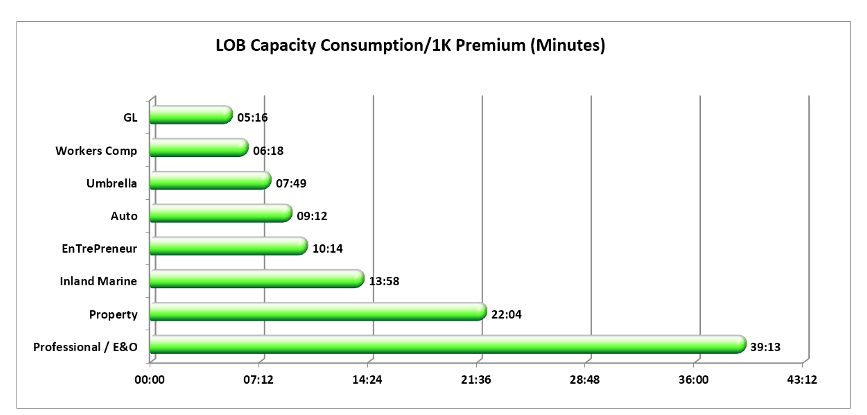
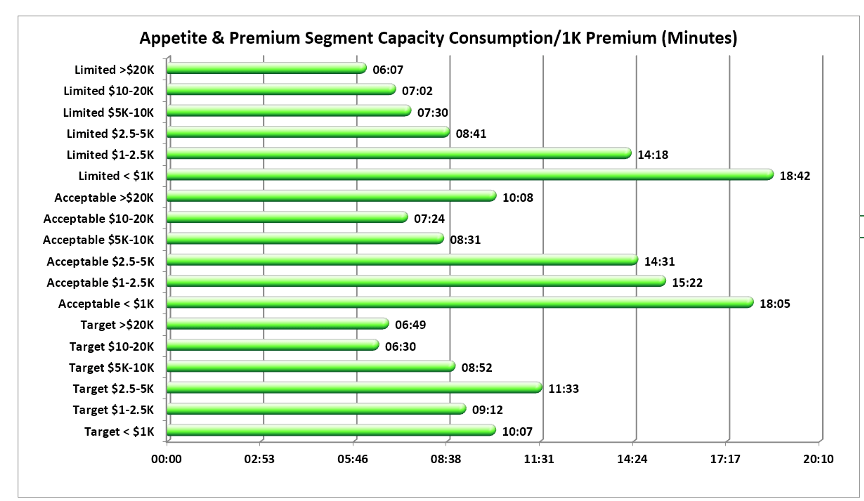
Resource Consumption Metrics
A corollary metric to productivity is resource consumption per standard set point. Resource consumption calculates how much resource time is consumed by a set point of revenue. Put another way: how much labor time is used to produce a certain level of revenue.
The set-point revenue used in these insurance examples is $1,000 of premium. In most organizations it is revenue or sales. A set- point of $1,000 is used because it makes it easy for managers to use for forecasting. For instance, if management wants to grow a line of business in a department by 40 million, and the resource capacity consumption for that line is 30 minutes per $1,000, it is easy to calculate that the additional $40MM will require approximately 11 more FTEs in that department. We used 1,800 hours per FTE to calculate 11 FTEs.
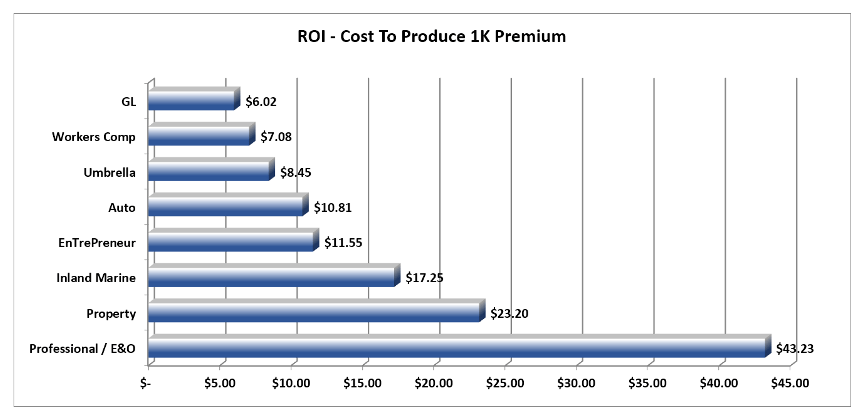
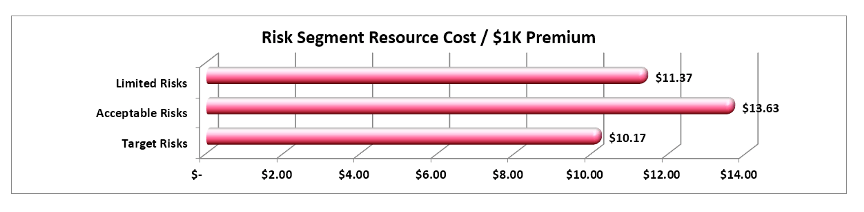
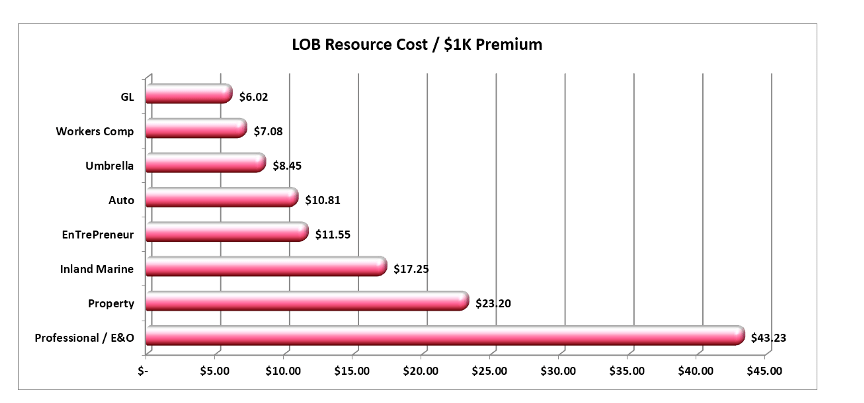
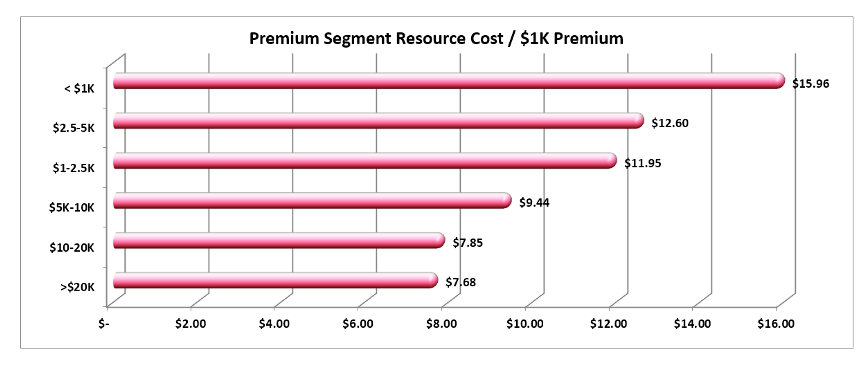
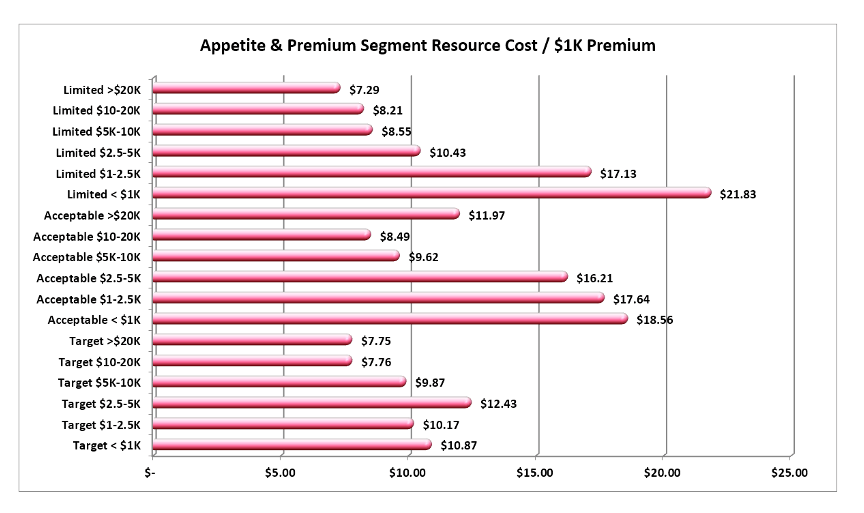
Resource Cost Metrics
Another corollary metric to productivity is resource cost per standard set point. Resource cost calculates the cost of labor resources for a set-point of revenue.
As above, the set-point revenue used in these insurance examples is $1,000 of premium. In most organizations it is revenue or sales. A set point of $1,000 is used because it makes it easy for managers to use for forecasting. For instance, if management wants to grow a line of business in a department by 40 million, and the resource cost per $1,000 is $30.00, it is easy to calculate that the additional $40MM will require an additional $1,200,000.00 labor budget.
Performance Management Metrics & Ratios Exhibits
The image carousel below displays AIM Performance Management Metrics & Ratio exhibits. You must have animations enabled for the carousels to work on your device. Follow these step if you don’t see scrolling images.
- Press Win + I to open Settings.
- Go to Accessibility and select Visual effects.
- Enable the toggle for Animation effects.
- Hover your curser over the slides to stop them.
- Reduce your browser display to 80% to see the entire slide (Hold Control (Ctrl) button down and roll mouse wheel toward you)

PM2R – Performance Management Metrics & Ratios Program
Executives use this business intelligence to improve their profitability, ROI and growth.
This program assembles sets of:
- Performance metrics; measurements that have a functional purpose such as a comparison chart of a product portfolio’s profit margins.
- Performance ratios; value calculations of 2 dissimilar, but related, quantities such as combining sales revenue with resource capacity time.
- With the performance metrics and ratios completed, the program then constructs management tools that executives and managers use to assess, monitor, and manage their day-to-day operational performance and develop their long-term strategic performance plans.
“You can’t get there from here if you don’t know where here is.”
Gary Meyer
If your profitability, growth, ROI and P/E are disappointing… let’s talk.
We’re performance management experts with new and powerful business intelligence tools that will produce the new results you need to succeed. Our contact information is below in the footer of this page.