These exhibits are fabricated mockups of AIM in an insurance company. While every client’s AIModels are unique for their specific problems and goals, all AIModels includes this core information group, referred to as CP2R: – customers – products – processes – resources
These exhibits are fabricated mockups of AIM in an insurance company. While every client’s AIModels are unique for their specific problems and goals, all AIModels includes this core information group, referred to as CP2R: – customers – products – processes – resources
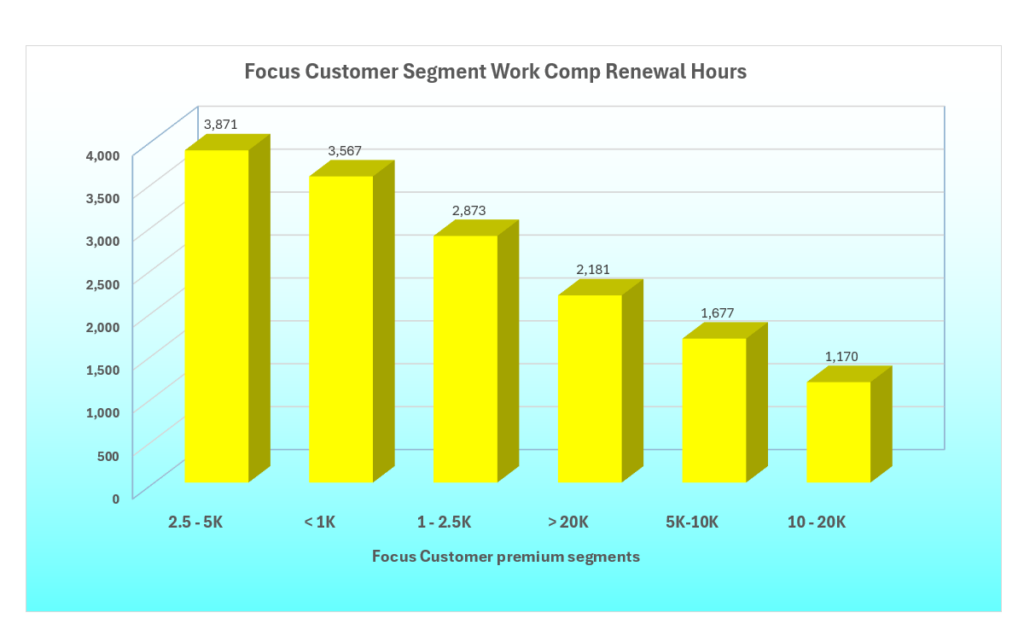
This graph is displaying the workers comp renewal hours for customer segments
This graph is displaying the workers comp renewal hours for customer segments.
Focus Customer Segment Work Comp Renewal Hours
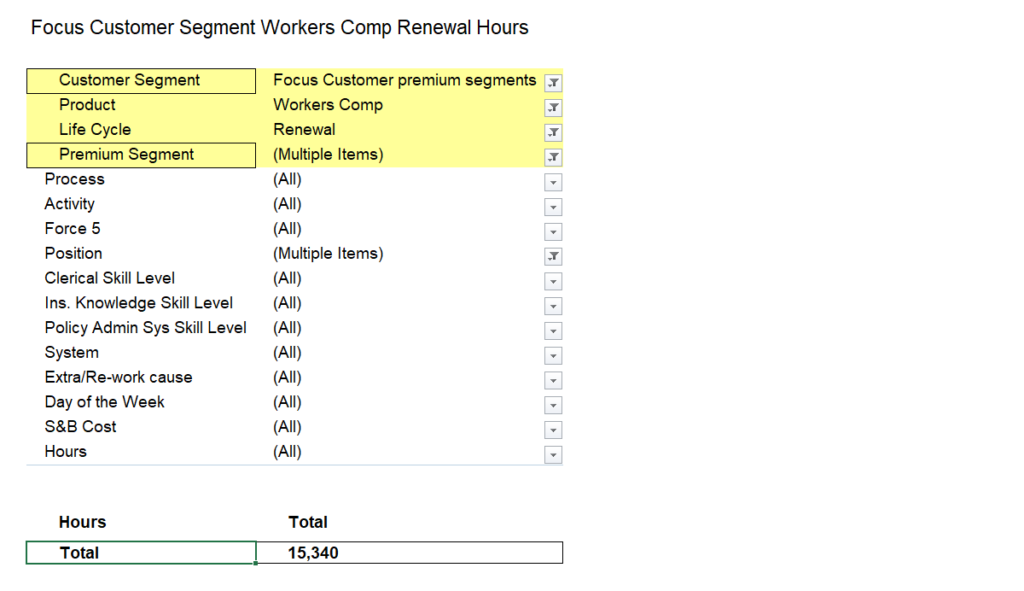
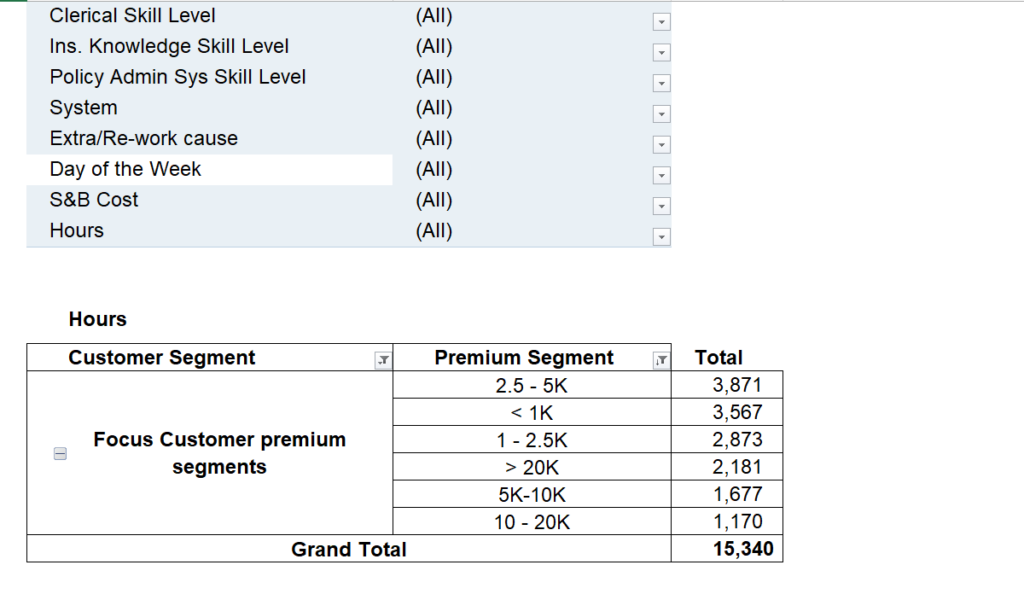
This Excel pivot table is an example of the kind of reporting tool we give our clients to explore their AIModel information.
In this case the Focus customer segment is selected, the Workers Comp product is selected, the 6 premium segments are selected, the renewal life cycle is selected and the hours is selected.
We have the annual workload for the Focus work comp renewals. We can also compare the resource capacity consumption among he customer premium segments.
Orient Point prepares analyses of the known problems and goals. Next we explore the AIModels with client personnel to discover unknown problems and opportunities. We then create
“what-if” scenarios to see the impacts of the changes being considered.
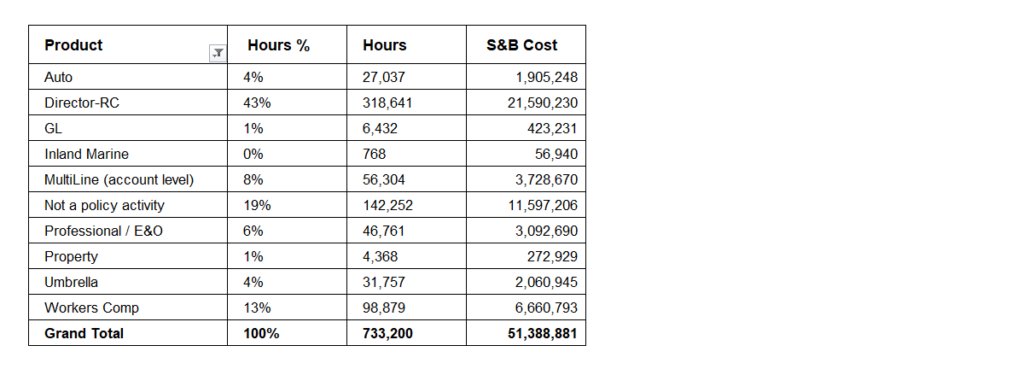
LOB & Product Hours %
Every executive knows the revenue for each product, but few know how many labor hours are consumed by their products and the cost of these hours. This graph displays how the resource capacity is consumed by each product. The chart below provides the hours and salary & benefit costs for each product.
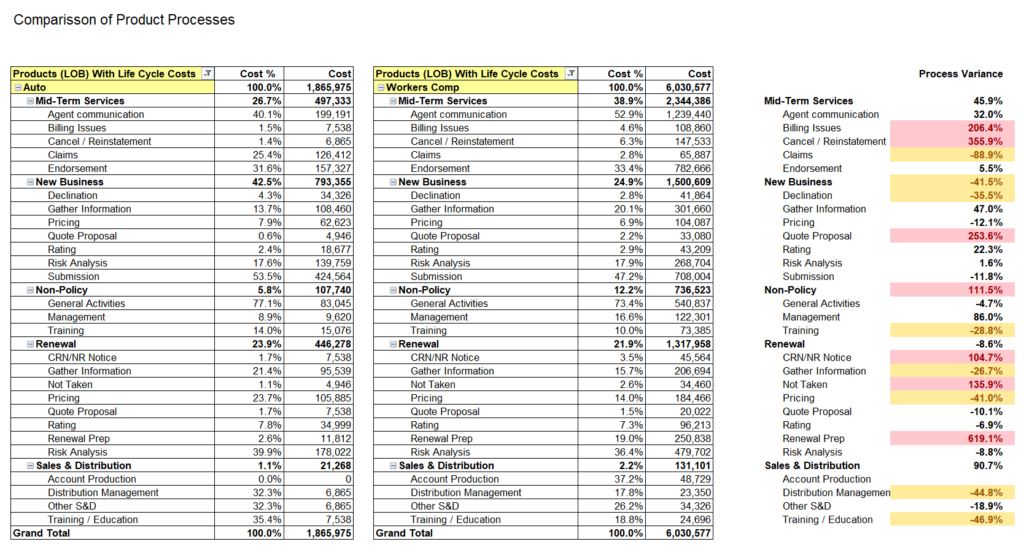
Comparison of Product Processes
The chart above is comparing the Auto product processes with the Workers Comp product processes. This is often a very helpful approach to find hidden process problems that are affecting a product’s performance.
This thorough analysis of every life cycle and process is impossible with traditional consulting methodologies. Activity Information Modeling makes it easy and economical.
As an aside comment; cost charts like this one and the entire AIModel are coveted by accounting departments because they provide cost information that is more accurate than they have, and it eliminates all of their costs to collect data and calculate costs. In large companies with many products, it’s normal for this to be four or more Accounting Dept. FTEs.
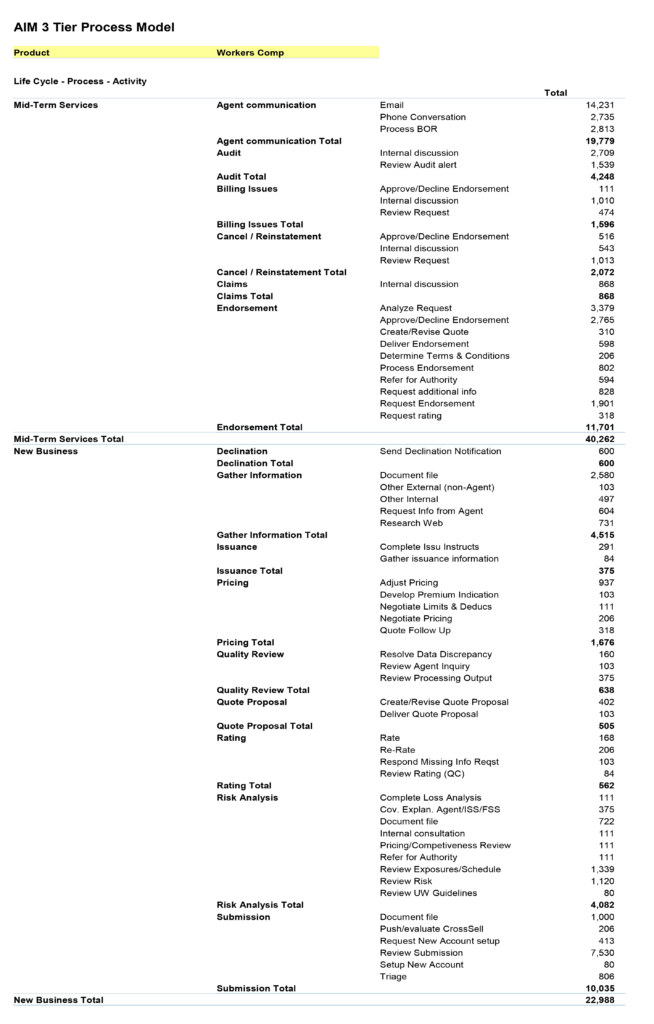
AIM 3 Tier Process Model
The chart above is displaying AIM’s 3 tier process model. This model is used for 90% of projects because it has consistently been successful at solving process problems and producing highly effective and valuable analytical reports and tools.
All services and products have a Life Cycle: a beginning, a middle and an end. A life cycle consists of a group of processes that are conducted during a specific stage of a service or product. The outcome of the entire Life Cycle the successful completion of all requiems for that stage.
A process is a noun that describes one outcome (completed operation) that is achieved with one or more activities (verbs).
An activity is a verb that describes a single completed action. An activity may have a number of tasks. For instance: “Correct account error” is an activity that is part of a customer service process. Correct account error may require tasks such as these: read screen, find error, type error correction, check account record for change.
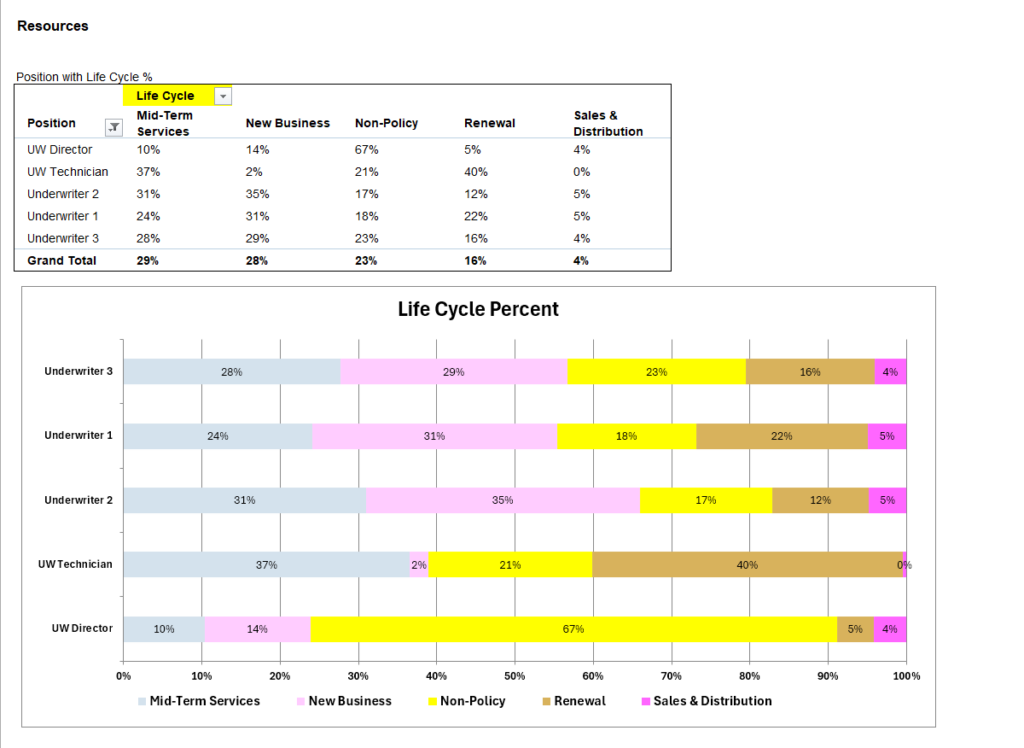
Job Positions (Resources) spent on the Life Cycles
This chart and graph display how much time the job positions (resources) spend on the Life Cycles. For instance; the Underwriter 2 position spends 35% of their working time on New Business.
Conducting very thorough analyses of the Resources is always important to the success of every AIM project because very many problems with customers, products and processes show up in the resource metrics.
In the chart above these observations jump out as likely problems. After showing them to client managers and analyzing them further, it’s likely they would become finding that would be documented with potential savings and performance improvements.
Sales & Distribution time is woefully low and probably too low to produce solid organic growth.
New Business hours and Mid-term Services hours are virtually the same. Something’s wrong: either the Mid Term Services is very inefficient or the volume of new business is very low.
Non-policy time is very high for the Underwriter positions. This is lost resource capacity that’s raising costs and reducing productivity and profits.
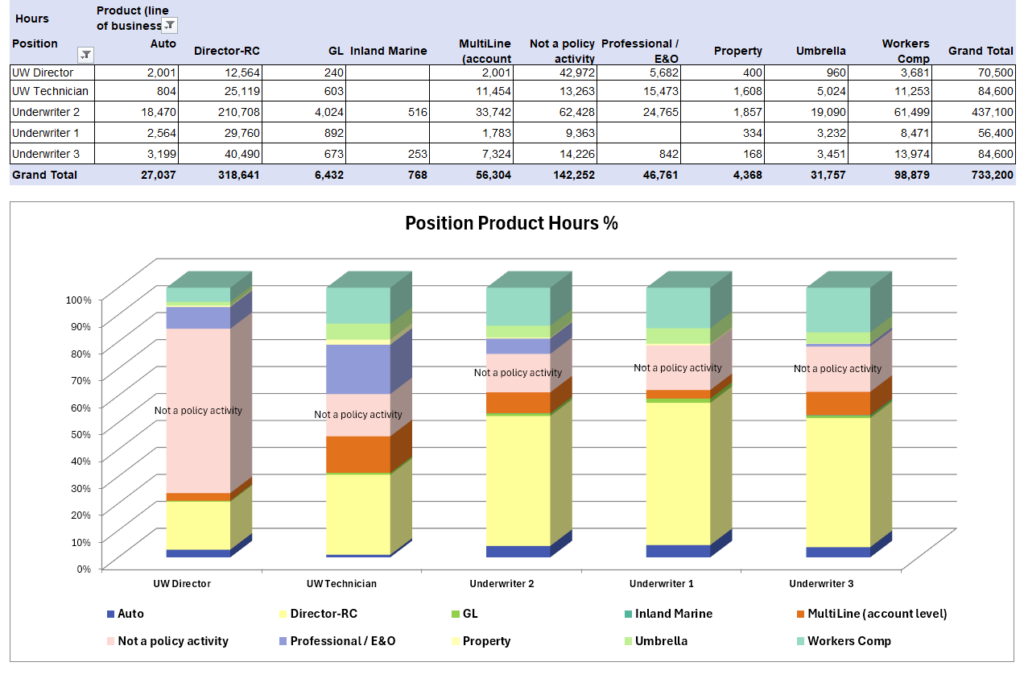
Positions Product Hours %
This chart and graph above display how many hours each Product consumes annually, also known as products’ workload. Information like this immediately sets some alarms off for most managers.
The workload for Inland Marine & Property are quite low. Are they specialized to a small group?
Is everyone being trained on these low volume products despite they probably never work on them?
“Not a policy activity” is stunningly high. It’s 100,000 hours of unproductive cost, or 50 FTE.
Professional E&O and Umbrella should be almost totally automated and handled by a Technician, not Underwriters. It looks like there’s very little automation to reduce labor hours.
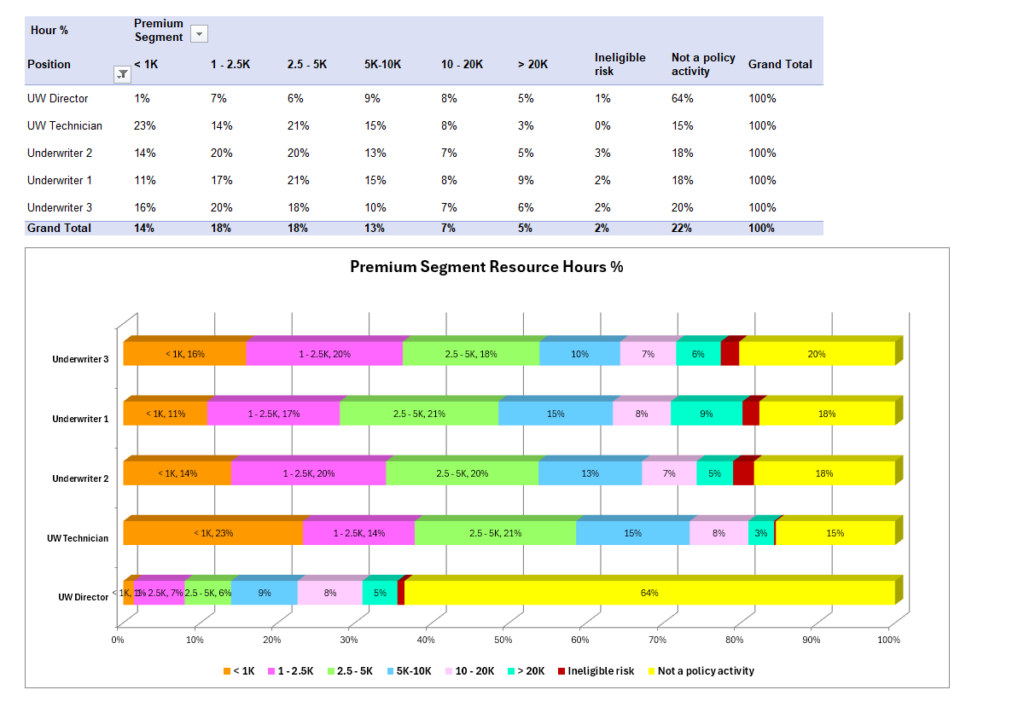
Premium Segment Resource Hours
Simply glancing at the graph above tells us that customers in 5K or less premium segments, the smallest segments, consume half of the resource capacity. We know that small accounts are price sensitive
and primarily transactional; two strong arguments for automating them.
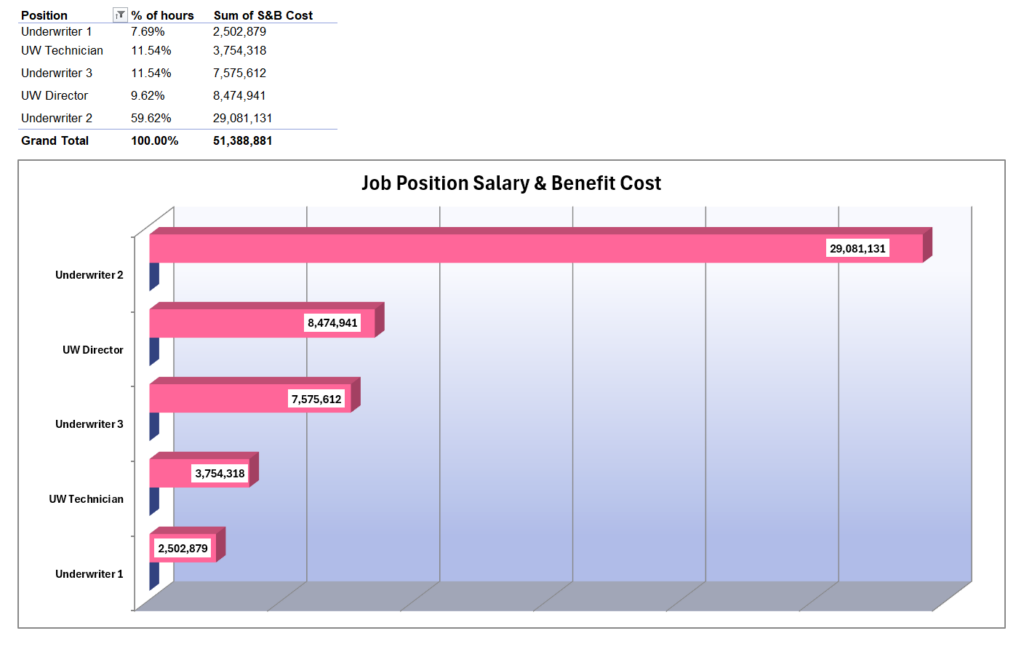
Job Position Salary & Benefit Cost
The chart and graph above display the job positions’ proportion of hours in the unit and the salary & benefit cost for that position. Note that UW Director position has the 2nd lowest hours but is the 2nd highest S&B cost. Also note the relatively low amount of hours for the UW Technician compared to the Underwriter positions. This appears to be a very low ratio of a support staff to professional staff.
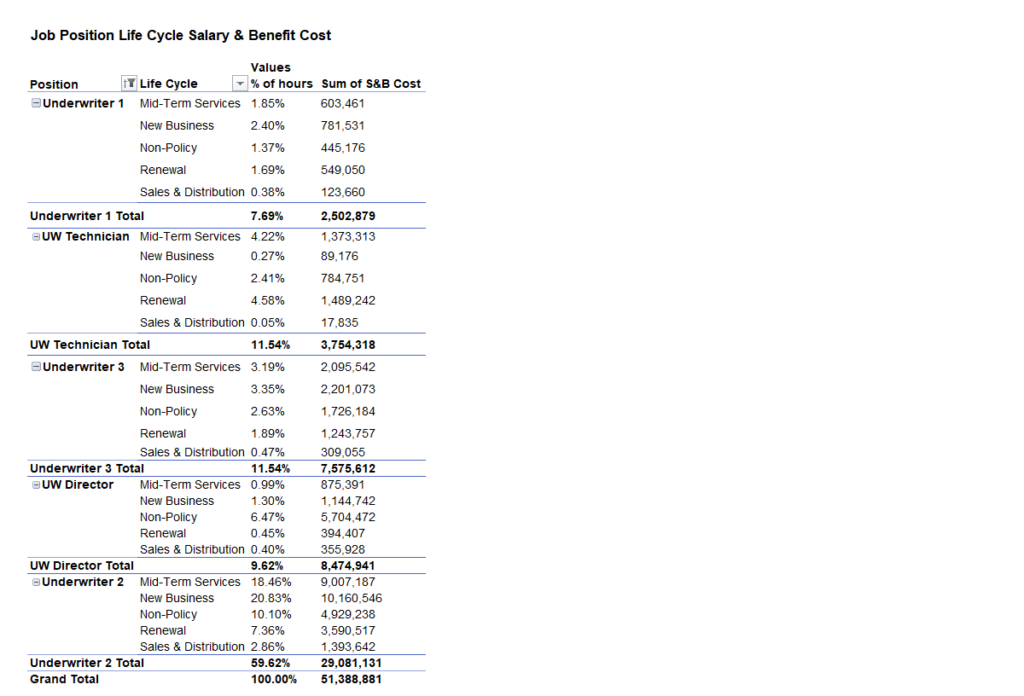
Job Position Life Cycle Salary & Benefit Cost
The chart above splits out how much time, as a percent of total work hours for the whole Underwriting unit, each position spends on the Life Cycles and the salary & benefit cost. It appears that everyone is involved with every life cycle despite that some positions are paid much more than others. Mid-Term Services and Renewals are mostly transactional and should not be conducted by higher paid the more expensive job positions.
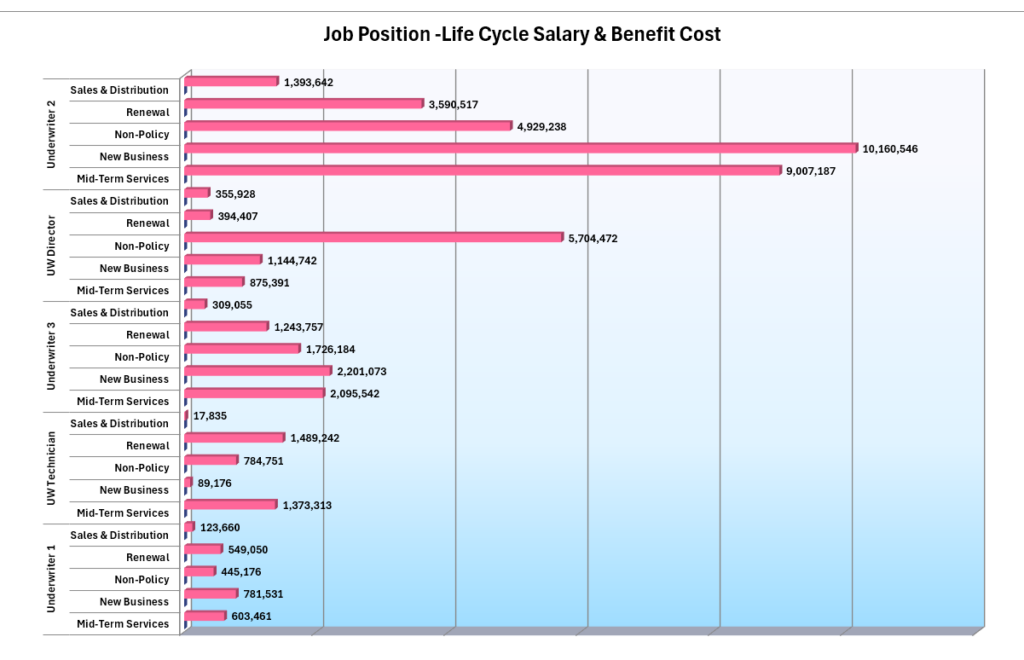
The graph above provides more information that supports the observation that the highest S&B positions are conducting Life Cycle work that lower paid positions should be handling. At this point, we can declare we have a finding, an opportunity to improve the unit’s performance.
We would create some scenarios that shift the Mid-Term Services work and the Renewal work to Underwriting (UW) Technicians. The various scenarios would include how many more UW Tech capacity hours are needed, how many Underwriter capacity hours would be freed-up and the new reduced cost of Mid-Term Services and Renewals.
Another 2 or more scenarios would show the new revenue (premium) growth possible if the Underwriters’ freed-up hours were shifted to New Business and Sales & Distribution. The growth would be significant.
AIM CP2R Summary
The AIM – Activity Information Modeling CP2R database provides a wealth of information about the four
areas of every enterprise. AIM collects new quantitative information, specifically about an organization’s problems and opportunities and thus gives the managers and or consultants a powerful ability to thoroughly analyze problems and create innovative solutions.